
The Visual Customization option:
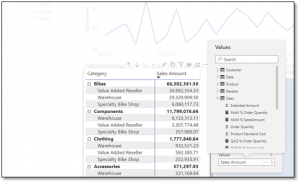
Luckily for us, Power BI has a visual customization option that allows users to transform existing visuals in their reports to better fit their own needs. Every Power BI user can use this feature and they can save their customizations by bookmarking them. All their changes will not affect the centrally managed and distributed report or app. Awesome right? This gives you the power to let your users have direct input in the report. However, with great power comes great responsibility. Keep in mind that when you activate the visual customization option, users will see all tables, columns, and measures of your report and will be able to swap or add them to their visuals.
This can be daunting if your data model is large, containing multiple tables, columns and measures. Furthermore, if users are unfamiliar with data modeling, they will also be at risk of combining measures with unrelated table columns. So be careful with the power you bestow on them. There is, however, a way to make life easier for your report users (and for you).
PERSPECTIVES:
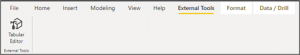
By using perspectives, you can decide which fields in your data model are shared with the user. To use them, you will first need to personalize the report’s visuals and create at least one perspective for the dimensions and measures you want users to work with. Power BI alone, however, does not have the option to create perspectives. You need to install Tabular Editor, a third-party software tool. After installing it, navigate to external tooling in the Power BI ribbon and open tabular editor.
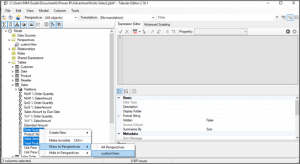
 Create a new perspective by right clicking on perspective and naming it however you like. For my example, I named my perspective “customView”. Once you have created your perspective, you can select the columns and measures you want to add. After you have made your selection, right click on one of the selected objects and show it in your perspective. You also need to enable the Personal Visualization option in your report settings: File > Options & Settings > Options > Current File > Report Settings.
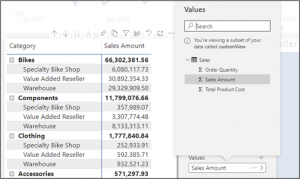
All we need to do now is assign the perspective to the visuals: I would not advise applying the personalization option on all visuals. There might be some static visuals or slicers running in your report and you do not want users to be able to mess with them. Navigate to the format pane and scroll down to personalize visuals until you see a new section – Personalize visual. Go ahead and change the Report-reader perspective to the perspective you have created.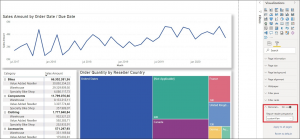
iT’S A WRAP!:
The only thing left to do is publish the report! Congratulations, you just improved the user experience by increasing the self-service level of your report. Now users can change their report by clicking on the personalized visual icon. Keep in mind that this feature is not available when publishing to the web and it is also not supported in the Power BI mobile apps for phones. As a workaround, you could change a visual and bookmark it in the Power BI service. All the changes will then be visible in Power BI mobile app too!
Stay tuned for my next blog where I will discuss a new Power BI topic!
Do you want to report with Power BI, or do you need Power BI expertise to take your current reports to the next level?
Do not hesitate to contact me at s.krijn@mmguide.nl.